
With the technology available in the nineteenth and twentieth centuries, astronomers made a number of wonderful discoveries about the nature of stars. These included knowledge of the true luminosity of stars as well as their chemical composition and temperature. Although all stars have a similar chemical composition, they come in a wide variety of luminosities and temperatures. As more stars were catalogued, astronomers began to notice a pattern. Secular, evolutionary thinking led to some false interpretations about the cause of this pattern. This lesson in history is an important one for us today.
Background
The invention of the telescope in 1608 and the invention of the spectroscope in 1814 changed astronomy forever. No longer was the field simply about accurately predicting the paths of the stars and planets. Astronomers were able to learn about the properties of stars from observations using these new scientific instruments. Precise telescopic observations had revealed that nearby stars do indeed appear to shift relative to background stars as the earth orbits the sun – an effect known as parallax. This allowed astronomers to compute the distance to nearby stars using trigonometry.
Astronomers also began to learn about the chemical composition of stars by analyzing their spectra (the dispersion of wavelengths of light) using a spectroscope. Each element produces a particular set of lines in a spectrum – a sort of “atomic fingerprint.” But the strength of these lines depends not only on the abundance of the element but also on temperature. Hence, spectroscopy made it possible to discover the precise surface temperature of any given star. Although all stars have approximately the same composition of hydrogen and helium gas, they come in a wide range of temperatures – from 3,000 to 40,000 Kelvins. Moreover, there were other subtle differences in the appearance of the spectral lines. As astronomers collected spectra from an increasing number of stars, they began to notice patterns in these spectra. And stellar classification was born.
Stellar Classification
Just as living organisms on earth can be classified taxonomically by their similarities and differences, astronomers of the late nineteenth and early twentieth century began classifying stars according to their spectral features. Much of this work took place at Harvard University under the leadership of Annie Jump Cannon. The field of photography had advanced to the point where astronomers could now record a star’s spectrum on film. Cannon and her team continually analyzed photographic plates of stellar spectra and classified stars accordingly. Originally, stars were classified alphabetically (A,B,C,D…) by the strength of their Balmer lines. Recall, the Balmer lines are the signature of hydrogen gas and are strongest at a temperature of about 9600 Kelvins.
Annie Cannon realized that some of these classes were redundant, so she combined them and eliminated certain letters. She also realized that the property of a star most relevant to its spectral features was the star’s surface temperature. So, she reordered the remaining stars in order from hottest to coldest according to the following system: O,B,A,F,G,K,M. Each class was further split into ten subdivisions, zero through nine, with higher numbers indicating lower temperature. The number is appended to the letter, e.g., A5, B8, K3. So, an A5 star is hotter than a K5 star which is slightly hotter than a K6 star. Astronomers today still use this same Harvard classification system to catalog stars.
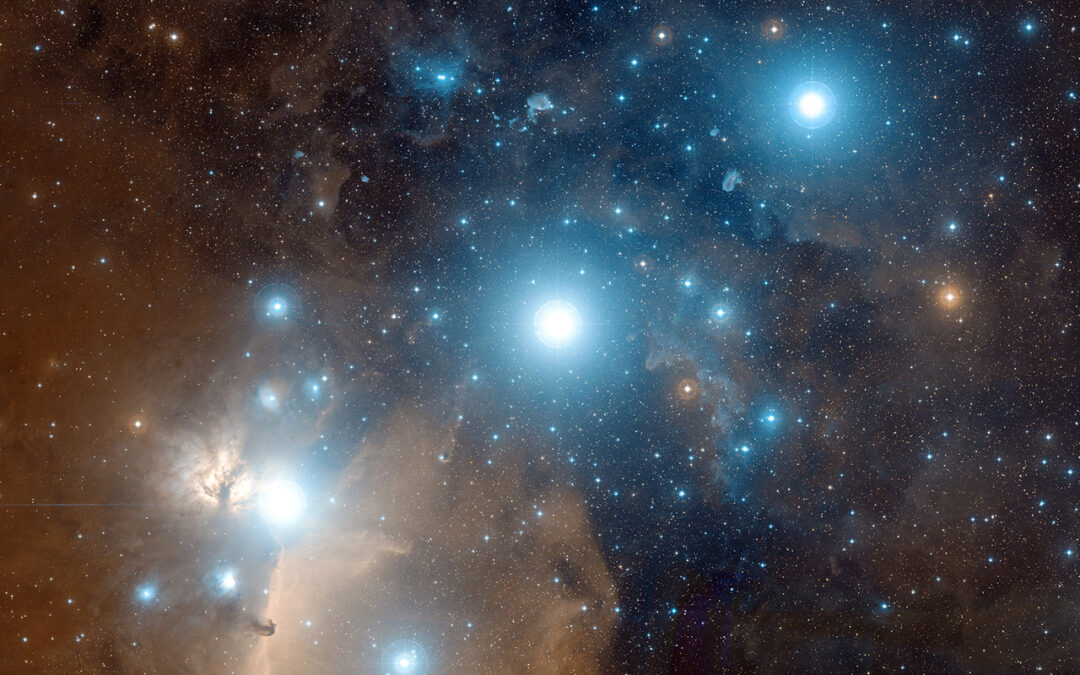
Type O stars are the hottest, with a surface temperature that can exceed 30,000 Kelvins. These stars are blue in color and tend to have extremely high luminosity. All O stars are significantly brighter than the sun. The left and right stars of Orion’s Belt, Alnitak and Mintaka, are both O9 stars. So, they are in the lowest temperature subdivision of the hottest class of star. Type B is the next hottest class after O. Alnilam, the center star of Orion’s belt is class B0. It is therefore only slightly cooler than Alnitak and Mintaka. You may notice that all three of these stars are light blue in color.
After the O- and B-type stars comes type A. Vega, the bright star that appears almost directly overhead on summer nights for mid-northern latitudes, is type A0. A-type stars still look slightly blue but less saturated. Vega has a surface temperature of around 9600 Kelvins. Class A stars have the most prominent Balmer lines.
The next hottest star class is type F. These stars are fairly white in color. Caph, a prominent star in the constellation Cassiopia, is type F2. The North Star, Polaris, is class F7.
Next, we have type G. The sun is a G2 star with a surface temperature of around 6000 Kelvins. G-type stars are white or slightly yellow in color. The next nearest star system is Alpha Centauri. It is a three-star system in which the brightest and most massive star (Alpha Centauri A) is type G2, just like the sun.
K stars are slightly cooler than the sun and produce a red/orange hue. Aldebaran, the “eye” of the constellation Taurus the bull, is class K5, and its color is quite noticeable. The northern hemisphere spring star Arcturus is class K2. It too has a distinctly red/orange color consistent with its surface temperature of 4400 Kelvins.
Finally, type M stars are the coolest and reddest. Betelgeuse, the bright red star of Orion’s upper left shoulder, is type M2. It is one of the brightest red stars in the (northern hemisphere) winter sky. For the summer, a bright M1 star is Antares in the constellation Scorpius. It is noticeably red and people sometimes mistake it for the red planet Mars. In fact, its name means “rival to Mars” (where Mars is the Roman term for the Greek god Ares, hence Ant-Ares).
A Pattern Emerges
For all of the nearby stars that have detectable parallax, we can compute their approximate distance from the sun. And by measuring their observed brightness and comparing it with their distance, we can compute their true brightness – their luminosity. So, by the early twentieth century, the luminosity of many nearby stars had been discovered. Astronomers had also measured the precise surface temperature of these stars by spectroscopy and determined their corresponding class. Two enterprising astronomers wondered if there was any connection between the brightness of a star and its surface temperature. Working independently, Ejnar Hertzsprung and Henry Norris Russel, in 1911 and 1913 respectively, created a scatter plot for stars whose luminosity and temperature class were known. For each star, they plotted a point of coordinates (x, y) where the x position indicates the spectral class (temperature) and the y position indicates the luminosity. The resulting graph yielded a surprising and wonderful result.
An early H-R diagram by Russel from 1914. The luminosity is plotted as absolute magnitude. The majority of stars fall between the two lines.
This plot is now referred to as a Hertzsprung-Russell diagram or H-R diagram. Notice first of all that the x-axis is “backward” from what people may expect. That is, the surface temperature of stars decreases as the x position increases. This is because the stars are listed by order of spectral class beginning with the hot O-type stars and ending with M-type stars. The y-axis is “normal” in that brighter stars are listed higher.
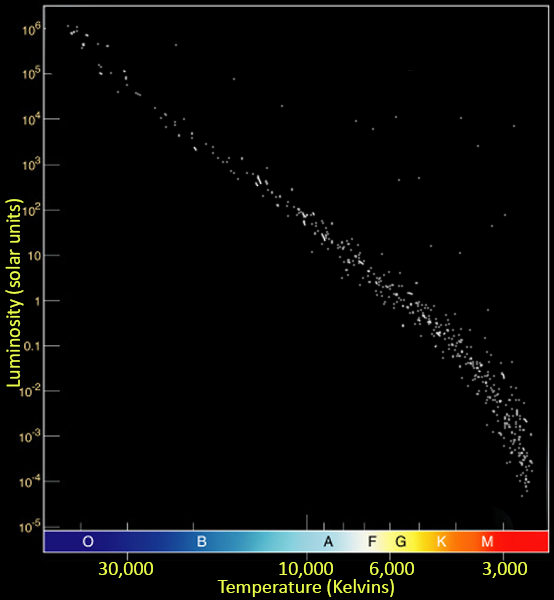
This is a modern, simulated H-R diagram. The majority of stars form a curve we call the main sequence.
The surprising result is that the majority of stars fell along a particular path – a slightly bent line going from the upper left to the lower right, which we now call the main sequence. We conclude from this that most of the low-temperature M-type stars have low luminosity. With a few exceptions, they are intrinsically much fainter than the sun. The hot blue O- and B-type stars are always far more luminous than the sun. But why? What is the cause of the main sequence?
Evolutionary Misdirection
The majority of scientists of the late nineteenth and early twentieth centuries rejected the historical account of creation in Genesis. Having been heavily influenced by the uniformitarians of the 1700s, they generally believed in a much older earth and an even older universe in which stars and planets formed by natural (rather than supernatural), extremely slow and gradual processes. Immanuel Kant proposed that the solar system formed from a collapsing cloud of gas – a nebula. This nebular hypothesis was further developed by Pierre-Simon Laplace and is still the basic idea held by most secular astronomers today.
If stars formed from a collapsing cloud over vast ages, then some probably formed earlier than others. If stars form spontaneously over the secular age of the cosmos, then different stars should have different ages. Could the main sequence be an age sequence? This idea is in contrast to a straightforward reading of Genesis in which God made all the stars on the same day (day 4), and thus they all have the same age.
It is a tendency of secular thinking to assume that a sequence is a time sequence, representing stages of evolution. For example, in the biological world, evolutionists believe that amphibians evolved from fish and birds from reptiles. The taxonomic tree is interpreted as representing the progress of evolution over hundreds of millions of years. Conversely, creationists recognize that God has built order into His universe; thus, animals have similarities and differences so that we can study and classify them, just as we do with elementary particles.
Likewise, there is a reason for this main sequence of stars found on any H-R diagram. But secular astronomers initially assumed that it was a time sequence – showcasing the evolution of stars over billions of years. Just as hot glowing coal cools over time, perhaps the hot blue stars eventually cool to become yellow then red stars. They would become fainter as they run out of energy. This was one of the earliest models of stellar evolution. And it is wrong.
Not only is it wrong, but secular astronomers today would all agree that it is wrong. The main sequence has nothing whatsoever to do with age or stellar evolution. Blue main sequence stars never become yellow or red main sequence stars, nor the reverse. Today we understand the true cause of the main sequence, and it has nothing to do with time or evolution. Yet, we still retain some of the nomenclature. To this day, O and B stars are referred to as “early” type stars whereas K and M stars are referred to as “late” type stars. Furthermore, it is appropriate to say that a G2 star is “earlier” than a G9 star. Today, “early” and “late” merely refer to a star’s position on the x-axis of an H-R diagram. It has nothing to do with actual age but is a reminder of a now-discredited model.
There is a lesson here. Today secular astronomers have ideas about how stars evolve over billions of years – modern versions of stellar evolution. And they are just as confident in them as their predecessors were in the old (now defunct) model. Yet we have not scientifically observed any of the kinds of changes that are now assumed in the standard secular model. Perhaps these newer patterns also have a non-evolutionary explanation. Time will tell.
There are genuine time sequences in nature. We can plot the growth of an acorn into a mighty oak tree. But then again, we have documented this process many times. It is based on observations available today and can be tested in the present. However, most secular models claim that stellar evolution takes millions of years and is therefore something that could not have been observed by humans. This should give pause to all thinking people when drawing conclusions about stellar evolution from our limited data.
So, if time is the not the cause of the main sequence, what is? The answer is mass. The mass of a main sequence star determines both its luminosity and temperature. So, the main sequence is not an evolutionary sequence at all but rather a mass sequence. In the next entry we will examine how this was discovered and explore its amazing implications.