

In part 1, we examined how to measure the distance to relatively nearby stars using parallax. We then showed how astronomers compute the luminosity of a star by comparing its apparent brightness with its distance. This shows that stars are comparable in brightness to the sun. But how do we know that stars have the same composition as the sun? For that matter, how do we know what the sun is made of?
Spectroscopy
For centuries, scientists have known that sunlight directed through a prism will split into multiple colors. We now understand that each color corresponds to the wavelength of the light. Violet light has the shortest wavelengths of around 400 nanometers, whereas red light has the longest wavelengths of around 700 nanometers. When multiple wavelengths are combined in roughly the same proportions, we perceive the color white.
The physicist and lens manufacturer Joseph von Fraunhofer invented the spectroscope in 1814. This device splits light into multiple wavelengths, like a prism, but with a much wider dispersion called a spectrum. When sunlight is passed through a spectroscope, a beautiful spectrum emerges. However, there are a number of narrow black lines in this spectrum, indicating that certain very specific colors are missing.[1] Since each color in a spectrum corresponds to a specific wavelength of light, this indicates that the sun does not emit all wavelengths equally – a few are missing. Joseph von Fraunhofer carefully measured the positions and strengths of these narrow lines in the sun’s spectrum.[2] To this day, we refer to the main lines in the solar spectrum as the Fraunhofer lines. But what was causing them?
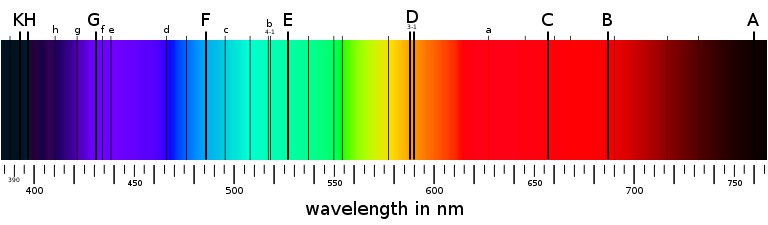
The solar spectrum showing the Fraunhofer lines.
In 1859, the physicist Gustav Robert Kirchhoff and chemist Robert Wilhelm Eberhard von Bunsen used a spectroscope to examine light emitted by heated gas. They found that a given element produced only certain specific wavelengths of light, and no others. These appeared as bright, narrow lines in an otherwise empty spectrum. Since each element produces a unique combination of lines, they act as an atomic fingerprint. Merely by examining the positions of the lines we can discover the composition of the substance that emitted the light!
For example, hot hydrogen gas always produces four dominant spectral lines at specific wavelengths: red (656 nm), blue-green (486 nm), and two violet lines (434 nm, 410 nm). The distances between these lines as seen in a hydrogen spectrum follows a very specific mathematical pattern discovered by John Balmer in 1885. Physicists refer to this spectral pattern as the Balmer series. As the spectrum of other elements was discovered by heating their gas in a lab, scientists recalled the dark Fraunhofer lines in the solar spectrum. Can we determine the composition of the sun by examining the locations of the lines in its spectrum?

The spectrum of hot hydrogen gas.
Sure enough, four of the Fraunhofer lines exactly match the Balmer series – the same lines produced by hot hydrogen gas! Granted, the narrow lines in the sun’s spectrum are dark against a bright continuous background, whereas the lines produced by hot, rarified hydrogen gas are bright against a black background. But the positions are identical. The sun bears the unmistakable spectral fingerprint of hydrogen gas. In fact, hydrogen is the main component of the sun’s composition. Over time, other elements were identified in the sun (in much smaller portions) by matching their spectral lines to elements tested on earth.[3]

Top: The spectrum of hot hydrogen. Bottom: the solar spectrum. The C,F,f and h Fraunhofer lines match the spectrum of hydrogen.
In 1868, Pierre Janssen and Joseph Norman Lockyer independently discovered spectral lines in the sun that could not be matched to any known element on earth. They had discovered a new element entirely by its spectrum! This new “sun element” was named “helium” – after Helios, the Greek term for the sun. Some people believed that this element could only exist on the sun. However, in 1882, physicist Luigi Palmieri discovered helium in a lava flow from Mount Vesuvius. In 1895, chemist William Ramsey analyzed the spectrum of a gas locked in a chunk of uranium ore and found that it matched the sun element. So, helium is not unique to the sun after all. But it was indeed discovered on the sun by its spectral fingerprint before it was discovered on earth.
Types of Spectra
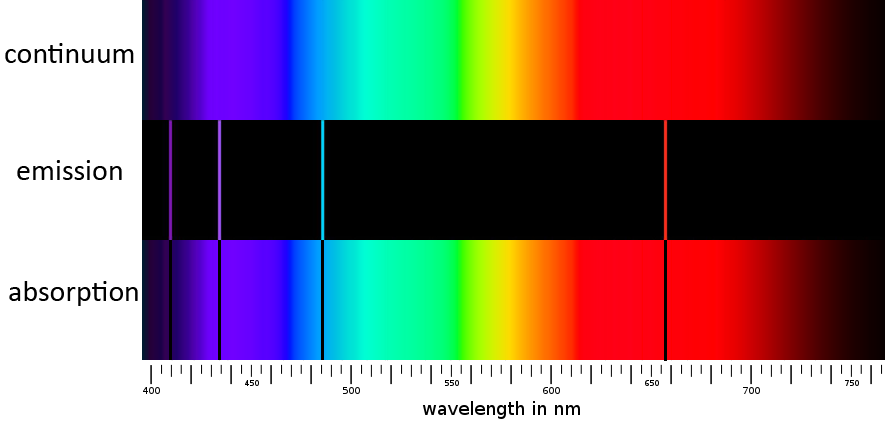
There are three primary types of spectra. When a solid or a highly condensed gas is heated, it emits a continuum spectrum (also called a blackbody spectrum). This is essentially a perfectly smooth rainbow with no colors missing. A continuum spectrum has no spectral lines, and therefore does not possess the “atomic fingerprint” of the substance that produced it.[4] It does, however, peak at a characteristic wavelength related to its temperature.
When a gas of low density is heated, it produces an emission spectrum. This spectrum is blank except for bright narrow lines that allow us to identify the substance producing the light.
Finally, when the light from a hot continuum spectrum is passed through low-density gas of lower temperature, an absorption spectrum emerges. This is like a continuum spectrum except certain narrow bands of color are suppressed. These absorption lines are in exactly the same location as the emission lines that the same gas would produce if heated to a higher temperature.
The sun, of course, produces an absorption spectrum. From this, we deduce that the outer, visible layer of the sun is cooler than the layers beneath it.[5] Furthermore, the inner layers of the sun must be very condensed in order to produce a continuum spectrum which then becomes an absorption spectrum after passing through the outer, cooler layers of hydrogen. So, spectroscopic analysis not only tells us the composition of the sun, but it also tells us something about its structure.
Interestingly, scientists of the 1800s did not know why these spectral lines occurred. Why does hot hydrogen produce only certain wavelengths of light, whereas hot helium produces different wavelengths? And why do these gases absorb those same wavelengths when light from a continuum spectrum is passed through them? The answer to these questions would not come until the twentieth century. However, knowing the cause of spectral lines is not necessary to identify the element responsible for them.[6] By the end of the nineteenth century, scientists had identified the spectral characteristics of many elements by direct observations. And this would allow astronomers to identify those elements (if they should occur) in any given star by analyzing the star’s spectrum.
Spectroscopy of Stars
In 1872, John William Draper became the first person to record absorption lines in a star other than the sun, namely the bright star Vega. He found that Vega had the same characteristic absorption lines associated with hydrogen – the Balmer series. Today, we have recorded spectra of countless thousands of stars. And we have found that all of them are made of hydrogen and helium – just like the sun. From analyzing the spectral lines, we know that about 92% of the atoms in the sun are hydrogen, and 8% are helium.[7] Other heavier elements have also been identified in quantities less than 1%. By mass, the sun is about 74% hydrogen and 26% helium. This is because the helium atom is four times heavier than hydrogen and gets four “votes” by mass, whereas hydrogen gets only one. Similarly, other stars are around 74% hydrogen by mass and 26% helium with lesser amounts of trace elements. So, stars are indeed suns. They all have nearly identical compositions.
The spectrum of a star not only reveals its composition but also its surface temperature. This is because the spectral lines associated with a given element are strongest at a given temperature. For example, the hydrogen lines are most prominent in stars with a surface temperature of around 9600 Kelvins. So, spectroscopy allows astronomers to make very precise estimates of the surface temperature of a star. This is how we know that some stars are cooler than the sun and other stars are hotter. But you don’t need a spectrum to make a rough estimate of a star’s surface temperature; you only need to know its color. Red stars are coolest with a surface temperature of around 3000 Kelvins. Yellow/white stars like the sun have a surface temperature of around 6000 Kelvins. The hottest stars are blue and have a surface temperature of up to 30,000 Kelvins.
Quantum Physics
Astronomers of the late nineteenth century did not know exactly why spectroscopy works. They knew by experimentation that certain elements produced very specific frequencies of light. But why? The answer came with the twentieth-century discovery of quantum physics.
Twentieth-century physicists discovered that subatomic particles have a wave nature. That is, they sometimes behave as if they are extended in space like the ripples that form when a stone is thrown into a pond. In 1925, Erwin Schrodinger discovered the equation that relates the properties of the wave to the particle’s mass and energy. When this equation is applied to a hydrogen atom, it shows that electrons can only exist at specific energy levels and not in between. Thus, an electron can orbit at level n=1,2,3,4,5, etc., but not at any non-integer levels. The Schrodinger equation also allows us to compute exactly what energy corresponds to each level. When comparing the difference in energy levels between level two and higher levels, an amazing result emerged: the Balmer series. That is, the wavelengths of light found in the Balmer series match the energy differences between level two and levels three, four, five and six respectively.
So, the red line (at 656 nm) of the Balmer series is produced when an electron drops from level three to level two. It must release a photon (a particle of light) with the same energy as the difference between those two levels. Likewise, the blue/green line (at 486 nm) is produced when an electron drops from level four to level two, and so on. Although the Schrodinger equation can be solved exactly only for atoms with only one electron, the same principle explains the spectral lines of other atoms. They are produced when an electron drops from a higher level to a lower level. Since different atoms have different energy levels, each produces a unique emission spectrum.
On the other hand, when the light of a continuum spectrum passes through cooler hydrogen gas, the hydrogen can only absorb those specific wavelengths that correspond to an energy difference between two levels. So, if the atom has an electron in energy level two, it can absorb only those wavelengths of light corresponding to the Balmer series, which will cause the electron to jump up to a higher level. This is why spectral lines are dark in an absorption spectrum.
With these discoveries, we now also understand why spectral lines of a given element are most prominent at a certain temperature. For example, why is the Balmer series most prominent in stars with a surface temperature of about 9600 Kelvins? Temperature is associated with atomic motions – higher temperatures imply more atomic collisions which can cause electrons to jump to higher levels. At cooler temperatures, the electrons exist mainly in the ground state (n=1). At such low temperatures, hydrogen gas cannot absorb light at the Balmer wavelengths because the electron is at n=1, not n=2. Conversely, if the gas is too hot, then the electrons will be mainly in the upper levels and not n=2. So, again, the gas cannot absorb the wavelengths associated with the Balmer series. Therefore, the Balmer series is most prominent at a temperature in which the maximum percentage of hydrogen atoms have their electron in the second energy level. Since the energy levels are different for various atoms, comparing the relative strengths of absorption lines gives not only the relative abundances but also the star’s surface temperature.
Doppler Motions
There are many additional facts that can be learned by studying a star’s spectrum. A particularly significant one is the star’s motion along our line of sight. Stars do move. But they are so far away that their motion is not easily noticed. However, motion toward or away from observers on earth results in a Doppler shift. Stars that are moving toward earth have spectral lines that are shifted toward shorter wavelengths – they are said to be blueshifted. Stars receding away from earth are redshifted. This does not strongly affect the overall color of a star. In other words, a red star that is blueshifted still looks red. Rather, the Doppler shift affects the positions of the absorption lines in its spectrum – shifting them toward the red end or the blue end. From this we can deduce the radial velocity of the star.
The Doppler shift of a star as seen from earth changes slightly through the year because the earth orbits the sun. Observations of stellar spectra confirm that when earth is on one side of the sun and moving toward a star, the spectrum is slightly blueshifted compared to observations made six months later when earth is on the opposite side and moving away from the star. Thus, spectroscopy confirms that earth orbits the sun. Astronomers are careful to include earth’s motion when measuring the motion of stars based on their spectra.
Many binary stars (two or more stars that orbit their common center of mass) have been discovered by their spectra. Sometimes this is due to changing Doppler shifts. That is, some stars have a cycle of Doppler motion that indicates they are orbiting around another star which may or may not be visible. From its changing Doppler shift, we know that the star HDE 226868 orbits around an invisible companion (a black hole) every 5.5998 days.[8] In other cases, a star may have two overlapping spectra corresponding to two different temperatures. In such cases, we are seeing the combined light of two stars that are very close to each other.
More to Come
Spectroscopy has come a long way since Fraunhofer’s 1814 discoveries. It has allowed us to know the surface composition of stars, but it also gives us detailed information on their temperature and their motion. Combining this with the luminosity information obtained by comparing apparent brightness with the distance measured by parallax, astronomers began discovering patterns. Stars differ in brightness and surface temperature, but in a natural way that allows us to systematically classify them, as we will explore in the next entry.
[1] In fact, these lines are not completely black. But they are much darker than the colors surrounding them and often appear black by comparison.
[2] These lines had been seen previously by William Hyde Wollaston using a less developed instrument.
[3] Ground-based spectra also suffer from telluric contamination. This is the addition of absorption lines as sunlight passes through earth’s atmosphere; elements like oxygen imprint on the spectrum. These can be distinguished from solar or stellar absorption lines because (1) they appear in all spectra and (2) they are not affected by the Doppler shift of the source.
[4] It is actually quite difficult to produce a perfect continuum spectrum. Dark-colored solids tend to produce the best approximation – hence the term “blackbody.”
[5] If the outer layers of the sun were hotter than the inner layers, the Fraunhofer lines would be bright rather than dark. That is, we would see an emission spectrum imposed on a continuum spectrum.
[6] In the same way, a person can be identified by his fingerprints even if we do not know the mechanism that causes the design of a person’s fingerprints.
[7] Spectroscopy only reveals the composition of the substance that produced the light – in this case, the solar surface (photosphere). However, hydrogen and helium are gases and mix easily for the outer layers of the sun. Furthermore, the density of the sun can be computed by measuring its mass (derived from the orbital period of the planets) and volume. The density is consistent with the composition of the interior being about the same as the surface.
[8] To be precise, the two objects orbit their common center of mass.